Essay
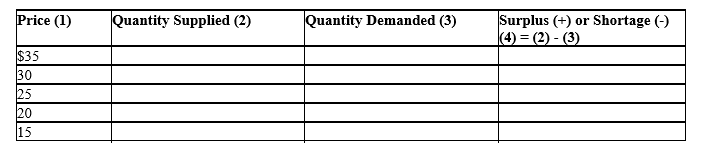
Demand and Supply Curves. The following relations describe demand and supply conditions in the oil industry:

where Q is quantity measured in millions of barrels and P is price in dollars.

Correct Answer:

Verified
Correct Answer:
Verified
Q1: Demand Analysis. The demand for high-definition television
Q2: Change in the quantity supplied reflects a:<br>A)
Q3: Demand Curve Analysis. Air California, Inc. is
Q5: The equilibrium market price of lead pencils
Q6: Comparative Statics. Demand and supply conditions in
Q7: Demand Analysis. The demand for automobiles is
Q8: Supply Curve Analysis. Computers.com is a leading
Q9: Utility is measured by:<br>A) wealth.<br>B) price.<br>C) value
Q10: Industry Supply. Stanford Plastics, Inc. and Cal-Tech
Q11: Optimal Supply. Shake-n-Shing, Inc., is a supplier