Multiple Choice
Samples of 200 parts were taken every day and the number of defectives was counted. What are the upper and lower limits for the percent defective chart? 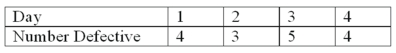
A) 0.02 and 0
B) 0.2970 and 0
C) 0.0297 and 0
D) 0.0497 and 0
Correct Answer:

Verified
Correct Answer:
Verified
Related Questions
Q3: If a company reports that its quarterly
Q73: A subassembly is inspected and the number
Q109: A new printing machine is set or
Q110: A new machine used in the production
Q111: A new machine is set or calibrated
Q112: A fishbone diagram is an _ tool.
Q115: A major distributor buys shoes from a
Q116: A major distributor buys shoes from a
Q117: A fishbone diagram starts with the definition
Q118: In an acceptance sampling plan, the incoming