Essay
An airline is investigating the causes of lost bags. The following table of data was collected over the last six months. 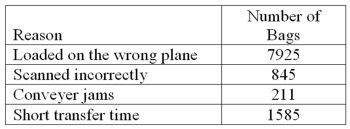 What percentage of bags is lost because of "conveyer jams"?
Correct Answer:

Verified
2%
Explanation: [(21...View Answer
Unlock this answer now
Get Access to more Verified Answers free of charge
Correct Answer:
Verified
2%
Explanation: [(21...
Explanation: [(21...
View Answer
Unlock this answer now
Get Access to more Verified Answers free of charge
Related Questions
Q1: What type of variation can be reduced,
Q2: The following are examples of attributes: the
Q3: The center line of a mean chart
Q6: A manufacturer of golf club shafts inspects
Q6: What chart helps to identify the relatively
Q8: A statistical quality control chart that is
Q11: Another name for the p-bar chart is
Q26: A quality control chart is used to
Q30: Control charts are used to determine if
Q34: The purpose of a statistical quality control