Essay
The following table shows the sales for a plastics manufacturer recorded over the past year. The seasonal indexes for each quarter are also provided. To track the trend for these four quarters, use the indexes to deseasonalize the sales data. 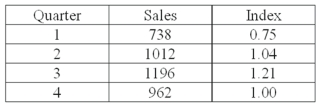 What is the deseasonalized sales value for quarter 1?
Correct Answer:

Verified
984
Explanation: Div...View Answer
Unlock this answer now
Get Access to more Verified Answers free of charge
Correct Answer:
Verified
Explanation: Div...
View Answer
Unlock this answer now
Get Access to more Verified Answers free of charge
Q11: The Durbin-Watson statistic is based on the
Q14: For a five-year moving average,how many values
Q25: What is the correct order of events
Q30: Autocorrelation is measured by the trend component
Q61: Using the following time series data, <img
Q66: Autocorrelation in a time series can be
Q67: Autocorrelation can be corrected by using a
Q68: The trend forecast equation is Ŷ =
Q75: What time-series component was exemplified during the
Q85: For the third quarter,the sales are 2,000