Essay
The following graph is used to evaluate two assumptions of a multiple regression analysis. What are the two assumptions? 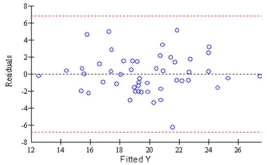
Correct Answer:

Verified
Linearity and homoscedasticity
Explanati...View Answer
Unlock this answer now
Get Access to more Verified Answers free of charge
Correct Answer:
Verified
Linearity and homoscedasticity
Explanati...
Explanati...
View Answer
Unlock this answer now
Get Access to more Verified Answers free of charge
Related Questions
Q24: If the correlation between the two independent
Q55: If the correlation between the two independent
Q59: Which of the following is a characteristic
Q92: A multiple regression analysis showed the following
Q94: Which statistic is used to test hypotheses
Q95: In multiple regression analysis, when the independent
Q98: In multiple regression analysis, residuals (Y -
Q100: A manager at a local bank analyzed
Q101: It has been hypothesized that overall academic
Q102: In a multiple regression analysis with five