Multiple Choice
A random sample of 30 executives from companies with assets over $1 million was selected and asked for their annual income and level of education. The ANOVA comparing the average income among three levels of education rejected the null hypothesis. The mean square error (MSE) was 243.7. The following table summarized the results: 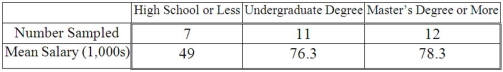 When comparing the mean annual incomes for executives with a high school education or less and those with an undergraduate degree, the 95% confidence interval shows an interval of 11.7 to 42.7 for the difference. This result indicates that __________________.
A) there is no significant difference between the two incomes
B) the interval contains a difference of zero
C) executives with an undergraduate degree earn significantly more than executives with a high school education or less
D) executives with an undergraduate degree earn significantly less than executives with a high school education or less
Correct Answer:

Verified
Correct Answer:
Verified
Q1: When testing for differences between treatment means,the
Q73: A bottle cap manufacturer with four machines
Q74: A random sample of 40 companies with
Q75: The human resources department of a software
Q76: The F distribution is a _ distribution.
Q77: Assuming that the larger of two variances
Q79: A bottle cap manufacturer with four machines
Q80: ANOVA requires that the populations should be
Q81: In ANOVA, when we do not reject
Q82: The statistical technique used to test the