Multiple Choice
The following graph illustrates _______________. 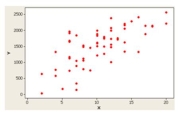
A) A positive or direct relationship
B) A negative or inverse relationship
C) No relationship
D) A distribution for a single variable
Correct Answer:

Verified
Correct Answer:
Verified
Related Questions
Q5: A scatter diagram is used to illustrate
Q15: The following stem-and-leaf display reports the number
Q16: If the coefficient of skewness is equal
Q17: Given the sample information in the following
Q20: The following stem-and-leaf display reports the number
Q21: The types of variables called _ are
Q24: In a scatter diagram, we describe the
Q28: What statistics are needed to draw a
Q49: A dot plot is an easy way
Q64: A large oil company is studying the