Essay
For the following data, what relationship is shown in the graph? 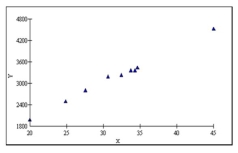
Correct Answer:

Verified
A positive relationship betwee...View Answer
Unlock this answer now
Get Access to more Verified Answers free of charge
Correct Answer:
Verified
A positive relationship betwee...
View Answer
Unlock this answer now
Get Access to more Verified Answers free of charge
Related Questions
Q3: What does the interquartile range describe?<br>A)The range
Q6: A dot plot is useful for quickly
Q15: Using the following statistics to describe a
Q17: A stem-and-leaf diagram shows the actual data
Q45: Quartiles divide a distribution into four equal
Q99: The following graph is _. <img src="https://d2lvgg3v3hfg70.cloudfront.net/TB2537/.jpg"
Q100: The interquartile range is graphically presented in
Q101: A contingency table would be used to
Q104: The interquartile range is the distance between
Q108: The 67<sup>th</sup> percentile is:<br>A) the value above