Multiple Choice
Refer to the following distribution of commissions: 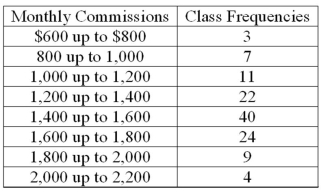 To plot a cumulative frequency distribution, the first coordinate would be _________.
A) X = 0, Y = 600
B) X = 500, Y = 3
C) X = 3, Y = 600
D) X = 600, Y = 0
Correct Answer:

Verified
Correct Answer:
Verified
Related Questions
Q19: The following frequency distribution shows the distribution
Q21: A class relative frequency represents a _
Q22: Refer to the following wage breakdown for
Q23: For the following distribution of heights, what
Q25: To calculate a relative frequency, a class
Q26: Refer to the following breakdown of responses
Q27: What is the difference between a frequency
Q28: The first three class marks for a
Q29: Refer to the following distribution of commissions:
Q64: A frequency polygon is a very useful