Multiple Choice
Refer to the following breakdown of responses to a survey of room service in a hotel. 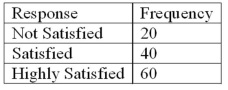 What type of chart should be used to show relative class frequencies?
A) A pie chart
B) A bar chart
C) A histogram
D) A frequency polygon
Correct Answer:

Verified
Correct Answer:
Verified
Related Questions
Q14: To convert a frequency distribution to a
Q46: A group of 100 students were surveyed
Q106: Refer to the following wage breakdown for
Q109: A table showing the number of observations
Q110: The suggested class interval for a frequency
Q112: The relative frequency for a class represents
Q113: A sample distribution of hourly earnings in
Q114: The midpoint of a class interval is
Q115: Refer to the following frequency distribution on
Q116: In a relative frequency distribution, the sum