Multiple Choice
Refer to the following breakdown of responses to a survey of "How confident are you that you saved enough to retire?" 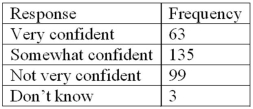 What type of chart should be used to show relative class frequencies?
A) A pie chart
B) A bar chart
C) A histogram
D) A frequency polygon
Correct Answer:

Verified
Correct Answer:
Verified
Related Questions
Q13: A pie chart is similar to a
Q43: The monthly salaries of a sample of
Q63: A data set consists of 40 observations.
Q64: Refer to the following breakdown of responses
Q67: A frequency distribution for qualitative data has
Q69: Refer to the following breakdown of responses
Q70: Refer to the following frequency distribution on
Q71: Refer to the following distribution of commissions:
Q72: A data set has 100 observations. In
Q73: What is the difference between a bar