Essay
Use a table of values as needed to graph the function, then state its domain and range. If the function has a pointwise discontinuity, state how the second piece could be redefined so that a continuous function results. 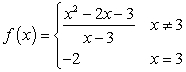
Correct Answer:

Verified
x  (-?, ?); y (-?, ?) (Gridl...
View Answer
Unlock this answer now
Get Access to more Verified Answers free of charge
Correct Answer:
Verified
View Answer
Unlock this answer now
Get Access to more Verified Answers free of charge
Q151: Use the following to answer questions :<br>A
Q152: Two points on L<sub>1</sub> and two points
Q153: Find the equation of the line which
Q154: Use the following to answer questions :<br>A
Q155: The following function is known to be
Q157: Graph the linear equation using the y-intercept
Q158: Use the following to answer questions :
Q159: Use the following to answer questions
Q160: Sketch the graph using transformations of a
Q161: Match each equation (a-f) to its graph