Multiple Choice
Exhibit 13-6
Part of an ANOVA table is shown below. 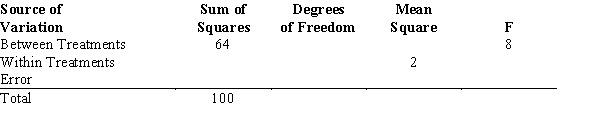
-Refer to Exhibit 13-6. If at 95% confidence we want to determine whether or not the means of the populations are equal, the p-value is
A) greater than 0.1
B) between 0.05 to 0.1
C) between 0.025 to 0.05
D) less than 0.01
Correct Answer:

Verified
Correct Answer:
Verified
Q5: Exhibit 13-6<br>Part of an ANOVA table is
Q6: Exhibit 13-7<br>The following is part of an
Q7: An experimental design where the experimental units
Q8: A factorial experiment involving 2 levels
Q9: Exhibit 13-5<br>Part of an ANOVA table is
Q11: Information regarding the ACT scores of samples
Q12: The critical F value with 6
Q13: Exhibit 13-7<br>The following is part of an
Q14: Random samples of individuals from three
Q15: Exhibit 13-2 <img src="https://d2lvgg3v3hfg70.cloudfront.net/TB2206/.jpg" alt="Exhibit 13-2