Multiple Choice
The accompanying graph 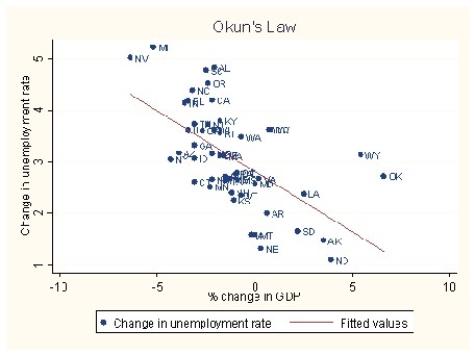 Is an example of
A) cross-sectional data.
B) experimental data.
C) a time series.
D) longitudinal data.
Correct Answer:

Verified
Correct Answer:
Verified
Related Questions
Q1: Econometrics can be defined as follows with
Q2: An example of a randomized controlled experiment
Q3: Give at least three examples from economics
Q4: To provide quantitative answers to policy questions<br>A)it
Q5: Ideal randomized controlled experiments in economics are<br>A)often
Q7: The reason why economists do not use
Q8: Most economic data are obtained<br>A)through randomized controlled
Q9: Analyzing the behavior of unemployment rates across
Q10: The most frequently used experimental or observational
Q11: In a randomized controlled experiment<br>A)there is a