Essay
For each of the accompanying scatterplots for several pairs of variables, indicate whether you expect a positive or negative correlation coefficient between the two variables, and the likely magnitude of it (you can use a small range).
(a) 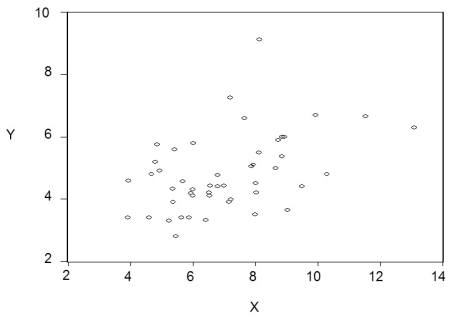 (b)
(b) 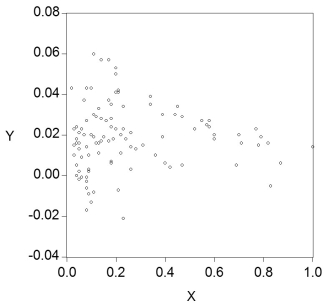 (c)
(c) 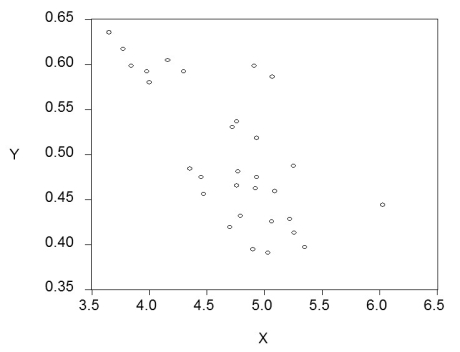 (d)
(d) 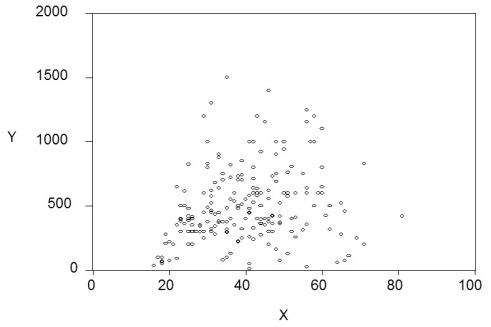
Correct Answer:

Verified
(a)Positive correlation. The actual corr...View Answer
Unlock this answer now
Get Access to more Verified Answers free of charge
Correct Answer:
Verified
View Answer
Unlock this answer now
Get Access to more Verified Answers free of charge
Q28: IQ scores are normally distributed with an
Q29: Assume that under the null hypothesis,
Q30: Think of at least nine examples, three
Q31: The following types of statistical inference are
Q32: The standard error of <span
Q34: Math SAT scores (Y)are normally distributed
Q35: At the Stock and Watson (http://www.pearsonhighered.com/stock_watson)website go
Q36: The sample covariance can be calculated
Q37: With i.i.d. sampling each of the
Q38: Your packaging company fills various types