Essay
(Continuation of the Purchasing Power Parity question from Chapter 4)The news-magazine The Economist regularly publishes data on the so called Big Mac index and exchange rates between countries. The data for 30 countries from the April 29, 2000 issue is listed below: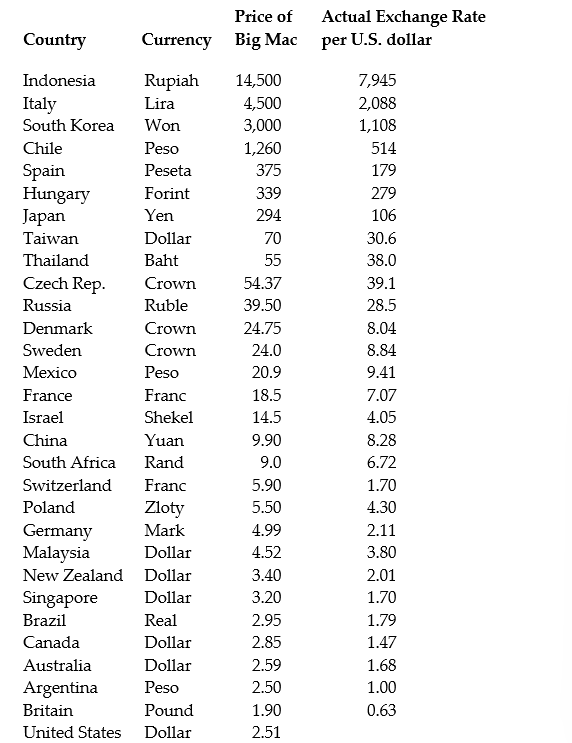
The concept of purchasing power parity or PPP ("the idea that similar foreign and domestic goods … should have the same price in terms of the same currency," Abel, A. and B. Bernanke, Macroeconomics, 4th edition, Boston: Addison Wesley, 476)suggests that the ratio of the Big Mac priced in the local currency to the U.S. dollar price should equal the exchange rate between the two countries.
After entering the data into your spread sheet program, you calculate the predicted exchange rate per U.S. dollar by dividing the price of a Big Mac in local currency by the U.S. price of a Big Mac ($2.51). To test for PPP, you regress the actual exchange rate on the predicted exchange rate.
The estimated regression is as follows: = -27.05 + 1.35 × 1.35×Pr edExRate R2 = 0.994, n = 29, SER = 122.15
(23.74)(0.02)
(a)Your spreadsheet program does not allow you to calculate heteroskedasticity robust standard errors. Instead, the numbers in parenthesis are homoskedasticity only standard errors. State the two null hypothesis under which PPP holds. Should you use a one-tailed or two-tailed alternative hypothesis?
(b)Calculate the two t-statistics.
(c)Using a 5% significance level, what is your decision regarding the null hypothesis given the two t-statistics? What critical values did you use? Are you concerned with the fact that you are testing the two hypothesis sequentially when they are supposed to hold simultaneously?
(d)What assumptions had to be made for you to use Student's t-distribution?
Correct Answer:

Verified
(a)Under PPP, H0 : ?0 = 0 and Ho : ?1 = 1. E...View Answer
Unlock this answer now
Get Access to more Verified Answers free of charge
Correct Answer:
Verified
View Answer
Unlock this answer now
Get Access to more Verified Answers free of charge
Q46: Using 143 observations, assume that you had
Q47: Let <span class="ql-formula" data-value="u _
Q48: You extract approximately 5,000 observations from
Q49: Using the California School data set
Q50: One of the following steps is
Q52: Imagine that you were told that
Q53: In general, the t-statistic has the
Q54: When estimating a demand function for a
Q55: The t-statistic is calculated by dividing<br>A)the OLS
Q56: You have collected data for the