Essay
You are presented with the following output from a regression package, which reproduces the regression results of testscores on the student-teacher ratio from your textbook
Dependent Variable: TESTSCR
Method: Least Squares
Date: 07/30/06 Time: 17:44
Sample: 1 420
Included observations: 420 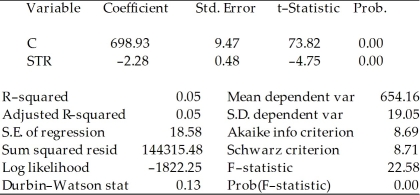 Std. Error are homoskedasticity only standard errors.
a)What is the relationship between the t-statistic on the student-teacher ratio coefficient and the F-statistic?
b)Next, two explanatory variables, the percent of English learners (EL_PCT)and expenditures per student (EXPN_STU)are added. The output is listed as below. What is the relationship between the three t-statistics for the slopes and the homoskedasticity-only F-statistic now?
Dependent Variable: TESTSCR
Method: Least Squares
Date: 07/30/06 Time: 17:55
Sample: 1 420
Included observations: 420 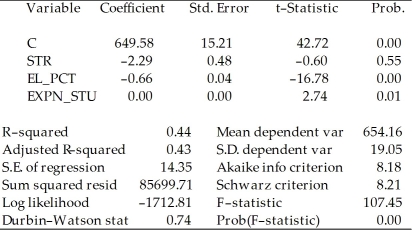
Correct Answer:

Verified
(a)The F-statistic tests the null hypoth...View Answer
Unlock this answer now
Get Access to more Verified Answers free of charge
Correct Answer:
Verified
View Answer
Unlock this answer now
Get Access to more Verified Answers free of charge
Q36: Consider the following two models to explain
Q37: The critical value of F<sub>4,</sub><sub>∞</sub> at the
Q38: If you wanted to test, using a
Q39: Consider the following regression using the
Q40: The administration of your university/college is
Q42: Your textbook has emphasized that testing two
Q43: At a mathematical level, if the two
Q44: Adding the Percent of English Speakers (PctEL)to
Q45: If the estimates of the coefficients of
Q46: You have collected data for 104