Essay
The figure shows is a plot and a fitted linear regression line of the age-earnings profile of 1,744 individuals, taken from the Current Population Survey. 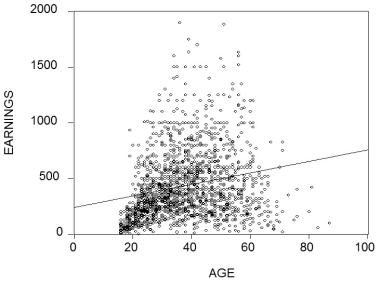 (a)Describe the problems in predicting earnings using the fitted line. What would the pattern of the residuals look like for the age category under 40?
(b)What alternative functional form might fit the data better?
(c)What other variables might you want to consider in specifying the determinants of earnings?
Correct Answer:

Verified
(a)There would be many overpredictions f...View Answer
Unlock this answer now
Get Access to more Verified Answers free of charge
Correct Answer:
Verified
View Answer
Unlock this answer now
Get Access to more Verified Answers free of charge
Q18: The following are properties of the logarithm
Q19: Consider a typical beta convergence regression function
Q20: You have been asked by your
Q21: A polynomial regression model is specified
Q22: To test whether or not the population
Q24: The interpretation of the slope coefficient in
Q25: In the model Y<sub>i</sub> = ?<sub>0</sub>
Q26: The following interactions between binary and continuous
Q27: Table 8.1 on page 284 of
Q28: (Requires Calculus)In the equation <span