Essay
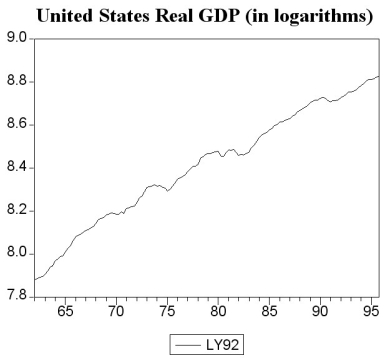
The following two graphs give you a plot of the United States aggregate unemployment rate for the sample period 1962:I to 1999:IV, and the (log)level of real United States GDP for the sample period 1962:I to 1995:IV. You want test for stationarity in both cases. Indicate whether or not you should include a time trend in your Augmented Dickey-Fuller test and why. 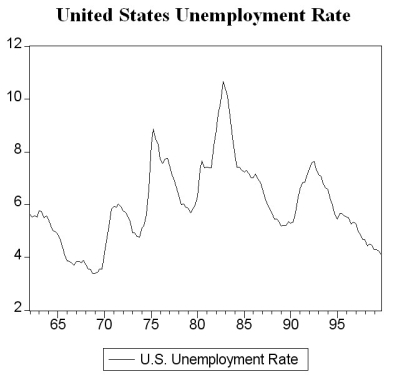
Correct Answer:

Verified
Looking over the entire sample period, t...View Answer
Unlock this answer now
Get Access to more Verified Answers free of charge
Correct Answer:
Verified
View Answer
Unlock this answer now
Get Access to more Verified Answers free of charge
Q39: (Requires Appendix material)Define the difference operator
Q40: The Bayes-Schwarz Information Criterion (BIC)is given
Q41: Find data for real GDP (Y<sub>t</sub>)for the
Q42: Consider the standard AR(1)Y<sub>t</sub> = β<sub>0</sub>
Q43: Consider the AR(1)model Y<sub>t</sub> = β<sub>0</sub>
Q45: You have decided to use the
Q46: You want to determine whether or not
Q47: (Requires Appendix material)The long-run, stationary state
Q48: Consider the following model<br>Y<sub>t</sub> = α<sub>0
Q49: You have collected data for real