Essay
You have collected quarterly Canadian data on the unemployment and the inflation rate from 1962:I to 2001:IV. You want to re-estimate the ADL(3,1)formulation of the Phillips curve using a GARCH(1,1)specification. The results are as follows:
(.48) (.08) (.10) (.09)
(.15)
(a)Test the two coefficients for and in the GARCH model individually for statistical significance.
(b)Estimating the same equation by OLS results in
(.54) (.10) (.11) (.08)
Briefly compare the estimates. Which of the two methods do you prefer?
(c)Given your results from the test in (a), what can you say about the variance of the error terms in the Phillips Curve for Canada?
(d)The following figure plots the residuals along with bands of plus or minus one predicted standard deviation (that is, ± )based on the GARCH(1,1)model. 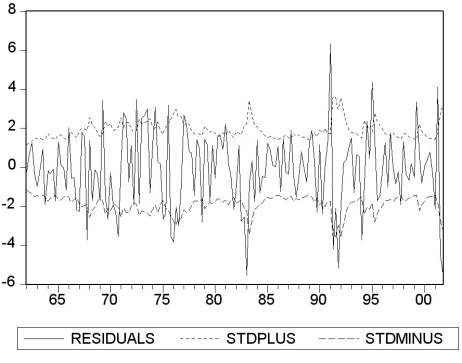 Describe what you see.
Correct Answer:

Verified
(a)The two t-statistics are 2.46 and 3.5...View Answer
Unlock this answer now
Get Access to more Verified Answers free of charge
Correct Answer:
Verified
View Answer
Unlock this answer now
Get Access to more Verified Answers free of charge
Q17: In this case, the Granger causality
Q18: ARCH and GARCH models are estimated using
Q19: You have collected quarterly data for
Q20: Think of at least five examples from
Q21: A vector autoregression<br>A)is the ADL model with
Q23: The dynamic OLS (DOLS)estimator of the cointegrating
Q24: Your textbook states that there "are
Q25: Consider the GARCH(1,1)model <span class="ql-formula"
Q26: What role does the concept of cointegration
Q27: The DOLS estimator has the following property