Multiple Choice
This table shows the values of the Canadian consumer price index (CPI) for the years 1998 - 2005.
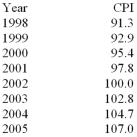
-Using the data in the table above,the rate of inflation between 2003 and 2005 was
A) 3.9%.
B) 4.1%.
C) 2.4%.
D) 1.7%.
E) 3.2%.
Correct Answer:

Verified
Correct Answer:
Verified
Related Questions
Q7: The tendency for nominal interest rates to
Q8: Changes in the average price level are
Q9: Unexpectedly low inflation _ borrowers and _
Q10: The real wage is the wage<br>A) measured
Q11: The Fisher effect is the tendency for
Q13: This table shows the values of the
Q14: A typical family on the Planet Econ
Q15: The consumer price index (CPI)is all of
Q16: The practice of increasing a nominal quantity
Q17: The downward nominal wage rigidity hypothesis says