Multiple Choice
The following table shows the production and prices of an economy's only two goods,TVs and computers,in 2003 and 2009.Assume that 2003 is the base year.
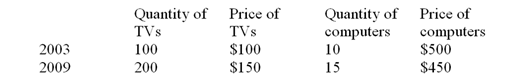
-What is the growth in real GDP over the period from 2003 to 2009?
A) 34%.
B) 78%.
C) 83%.
D) 138%.
E) 145%.
Correct Answer:

Verified
Correct Answer:
Verified
Q153: Over the 1992-2010 period,Canadian gross national product
Q154: Data for an economy show that the
Q155: An economy produces 500,000 tables valued at
Q156: Given the following data for an economy,compute
Q157: In a small town of 100 people,there
Q159: A jar of orange marmalade,ultimately sold to
Q160: Changes in business inventories are<br>A) classified as
Q161: Intermediate goods and services are _ production
Q162: A circular flow diagram that includes the
Q163: The number of people unemployed divided by