Multiple Choice
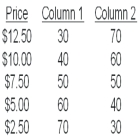
-As the price decreases,the behaviour of the data in Column 1 is most consistent with
A) a supply curve.
B) excess demand.
C) excess supply.
D) a demand curve.
E) an equilibrium.
Correct Answer:

Verified
Correct Answer:
Verified
Related Questions
Q60: At the beginning of the fall semester,university
Q61: <img src="https://d2lvgg3v3hfg70.cloudfront.net/TB3713/.jpg" alt=" -Which of the
Q62: <img src="https://d2lvgg3v3hfg70.cloudfront.net/TB3713/.jpg" alt=" -Moving from demand
Q63: Market Equilibrium and Shifts in Demand and
Q64: Without the aid of a graph,one can
Q66: When we move down along a given
Q67: Without the aid of a graph,one can
Q68: Suppose that the demand curve for a
Q69: An economic model used to analyze the
Q70: A market comprised of a downward-sloping demand