Multiple Choice
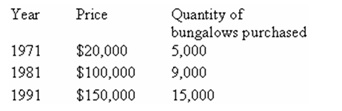
-The data show the quantity of small bungalows sold in a suburb of Toronto during the month of January.Based on the given data,we can conclude that:
A) the demand curve is not downward-sloping after all.
B) the demand curve is generally downward-sloping,but it does not apply to the housing market in Toronto.
C) there are exceptions to the generally downward-sloping demand curve;the period 1971 to 1991 is an example of such exceptions.
D) the demand curve for small bungalows around Toronto in 1971 to 1991 is upward-sloping.
E) over the 30-year period,the demand curve most likely shifted to the right.
Correct Answer:

Verified
Correct Answer:
Verified
Q44: If the wages paid to workers in
Q45: Market Equilibrium and Shifts in Demand and
Q46: <img src="https://d2lvgg3v3hfg70.cloudfront.net/TB3713/.jpg" alt=" -Assume supply and
Q47: Potential buyers and sellers of a particular
Q48: Some economics students cite the following three
Q50: <img src="https://d2lvgg3v3hfg70.cloudfront.net/TB3713/.jpg" alt=" -The equilibrium price
Q51: Suppose that both the supply of beer
Q52: Suppose that the price of beer increases.One
Q53: An increase in the price of Colgate
Q54: Suppose that the demand curve for a