Multiple Choice
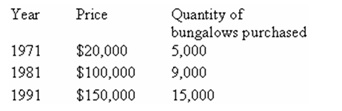
-The data show the quantity of small bungalows sold in a suburb of Toronto during the month of January.Based on the given data,we can conclude that
A) the demand curve for bungalows must have shifted to the right,but the supply curve has not shifted.
B) the supply curve for bungalows must have shifted to the right,but the demand curve has not shifted.
C) there is a movement upward along the 1971 demand curve.
D) there is a movement upward along the 1971 supply curve.
E) both the demand curve and the supply curve of 1971 have shifted to the left.
Correct Answer:

Verified
Correct Answer:
Verified
Q155: Suppose that the demand curve for a
Q156: <img src="https://d2lvgg3v3hfg70.cloudfront.net/TB3713/.jpg" alt=" -At a price
Q157: An increase in the demand for apples
Q158: When economists refer to small buyers in
Q159: Suppose that the demand curve for a
Q161: A shortage occurs when<br>A) demand is greater
Q162: Assume both the demand for and the
Q163: The essential difference between a change in
Q164: <img src="https://d2lvgg3v3hfg70.cloudfront.net/TB3713/.jpg" alt=" -At the point
Q165: <img src="https://d2lvgg3v3hfg70.cloudfront.net/TB3713/.jpg" alt=" -Assume that the