Multiple Choice
Refer to the graphs below.In the 1990s,corporations began to find new ways to incorporate recycled materials in new products.The effect on the market for recycled materials is best shown by 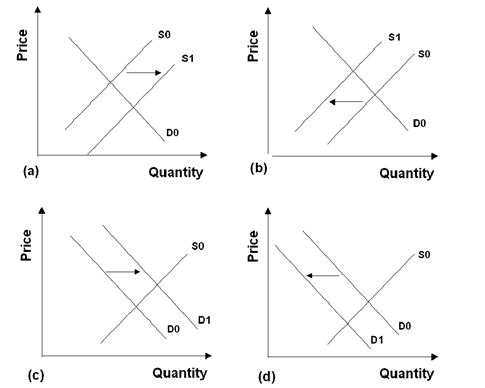
A) Graph (a) .
B) Graph (b) .
C) Graph (c) .
D) Graph (d) .
E) none of these graphs.
Correct Answer:

Verified
Correct Answer:
Verified
Q127: The statement that a market in equilibrium
Q128: A shift to either the left or
Q129: Market Equilibrium<br> <img src="https://d2lvgg3v3hfg70.cloudfront.net/TB3713/.jpg" alt="Market Equilibrium
Q130: Suppose that the demand curve for a
Q131: If both buyers and sellers expect the
Q133: If,when the price of X increases,the demand
Q134: <img src="https://d2lvgg3v3hfg70.cloudfront.net/TB3713/.jpg" alt=" -Which of the
Q135: Market Equilibrium and Shifts in Demand and
Q136: Assume that Joe is willing to produce
Q137: Which of the following is NOT true