Multiple Choice
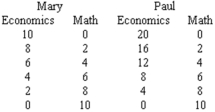
Refer to the graph below.Given Mary and Paul's production possibilities tables for answering economics and math problems,which curve represents their combined production possibilities curve if they take advantage of their comparative advantages? 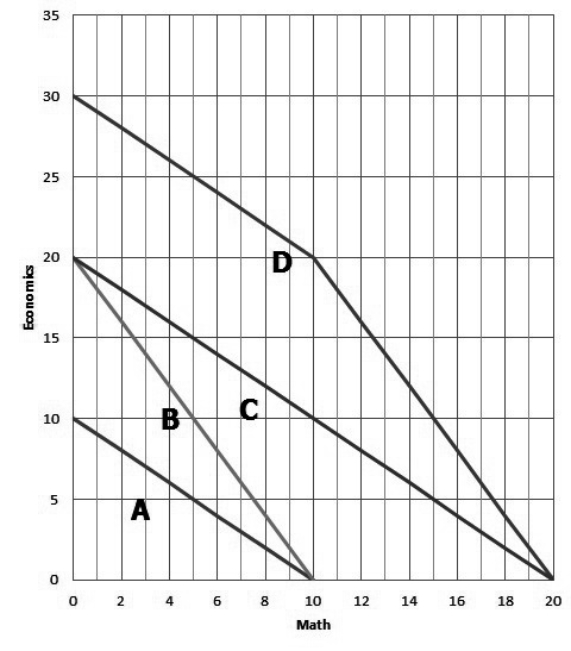
A) A
B) B
C) C
D) D
E) Not shown.
Correct Answer:

Verified
Correct Answer:
Verified
Q127: Point G is a(n)_ point in relation
Q128: If the production possibilities curve is smoothly
Q129: <img src="https://d2lvgg3v3hfg70.cloudfront.net/TB3713/.jpg" alt=" -Sam possesses an
Q130: Suppose that a further increase in specialization
Q131: Refer to the graph below.As you move
Q133: To say that an individual possesses an
Q134: An isolated economy has _ possibilities for
Q135: The production possibilities curve shows<br>A) the relationship
Q136: Economic growth can generally be represented by
Q137: <img src="https://d2lvgg3v3hfg70.cloudfront.net/TB3713/.jpg" alt=" -Sam's opportunity cost