Multiple Choice
The table below provides data on Canada's real GDP per person,average labour productivity and the share of population employed in 1960 and 2000.Use this information for the following questions.(Assume that between 1960 and 2000 there are 40 years) . 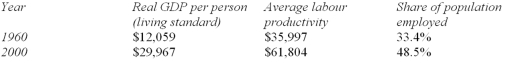
Between 1960 and 2000,Canada's GDP per person grew by ___________ percent,and over the same period,average labour productivity grew by ___________ percent and the share of the population employed grew by ___________ percentage points.
A) 148.5;71.7;15.1
B) 248.5;171.7;145.2
C) 155.5;79.7;45.2
D) 155.5;34.7;45.2
E) 148.5;71.7;145.2
Correct Answer:

Verified
Correct Answer:
Verified
Q52: Providing workers with on-the-job training will tend
Q53: In Econland,500,000 of the 2 million people
Q54: In Macroland,500,000 of the 1 million people
Q55: People who run businesses on a day-to-day
Q56: Mike and Tom debone chicken breasts for
Q58: Small differences in growth rates of real
Q59: The fact that the observed link between
Q60: The general thesis of the book The
Q61: One factor that contributed to the growth
Q62: Government support of basic research,by funding scientists