Multiple Choice
The table below provides data on Canada's real GDP per person,average labour productivity,and share of population employed in 1960 and 2000.Use this information for the following questions.(Assume that between 1960 and 2000 there are 40 years) .
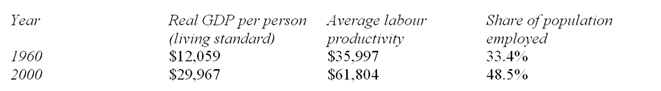
-Canada's real GDP per person in 1960,which shows the quantity of goods and services each person can consume in 1960,depends on the quantity of goods and services each worker can __________ in 1960,and the number of people (as a proportion of the total population) __________ in 1960.
A) produce;working
B) produce;not working
C) produce;not in the labour force
D) produce;in the labour force
E) consume;working
Correct Answer:

Verified
Correct Answer:
Verified
Q41: If a nation's real GDP is growing
Q42: An example of a government policy to
Q43: An aggregate production function is a mathematical
Q44: Holding all else constant,if average labour productivity
Q45: Dutch disease refers to<br>A) insects that devastate
Q47: Holding all else constant,if average labour productivity
Q48: The cost-benefit principle suggests that higher economic
Q49: The prediction that workers obtain additional training
Q50: Suppose Botswana doubles its income in 8
Q51: Each of the following statements describes how