Multiple Choice
The rightward shift in the LRAS curve shown in the diagram may be caused by an 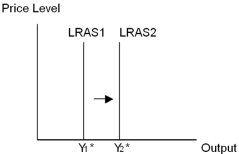
A) increase in both the availability of natural resources and the amount of the capital stock only.
B) increase in the availability of natural resources and an improvement in technology only.
C) improvement in technology and an increase in both the amount of the capital stock and in the size of the labour force only.
D) improvement in technology,and an increase in both the availability of natural resources and the amount of the capital stock only.
E) increase in the availability of natural resources,the amount of the capital stock and in the size of the labour force,and an improvement in technology.
Correct Answer:

Verified
Correct Answer:
Verified
Q81: The AD-AS model in the diagram below
Q82: An SRAS curve would be _ if
Q83: <img src="https://d2lvgg3v3hfg70.cloudfront.net/TB3713/.jpg" alt=" -The data provided
Q84: The Phillips curve is a statistical relationship
Q85: Suppose a stock market crash decreases the
Q87: A leftward shift in the LRAS curve<br>A)
Q88: A shift in the position of the
Q89: One explanation for the inverse relationship between
Q90: If the aggregate demand curve is represented
Q91: The AD-AS model in the diagram above