Multiple Choice
The leftward shift in the LRAS curve shown in the figure may be caused by 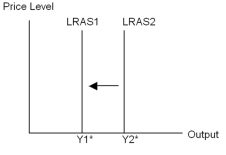
A) an increase in the availability of natural resources.
B) an increase in the size of the capital stock.
C) an improvement in technology.
D) an increase in the size of the labour force.
E) depletion of natural resources.
Correct Answer:

Verified
Correct Answer:
Verified
Q52: <img src="https://d2lvgg3v3hfg70.cloudfront.net/TB3713/.jpg" alt=" The SRAS is
Q53: In long-run equilibrium in the AD-AS model,which
Q54: When the price level falls,planned aggregate expenditure
Q55: The goal of monetary policy in Canada
Q56: The AD-AS model depicts a self-correcting economy.In
Q58: According to the expectations-augmented Phillips curve model,a(n)_
Q59: Consider an economy initially at long-run equilibrium
Q60: If everything else is held constant,a decrease
Q61: An economy characterized by the AD equation
Q62: If the SRAS curve is positively sloped,then