Multiple Choice
The downward shift in the short-run aggregate supply curve,from SRAS1 to SRAS2,shown in the diagram may be caused by a fall in the price of 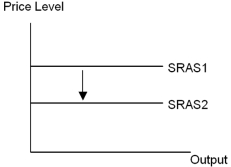
A) oil and labour only.
B) oil and capital only.
C) oil,labour,and capital only.
D) labour,capital and of an input that is widely used in production only.
E) oil,labour,capital and of an input that is widely used in production.
Correct Answer:

Verified
Correct Answer:
Verified
Q87: A leftward shift in the LRAS curve<br>A)
Q88: A shift in the position of the
Q89: One explanation for the inverse relationship between
Q90: If the aggregate demand curve is represented
Q91: The AD-AS model in the diagram above
Q93: Which one of the following neither causes
Q94: According to the AD-AS model,the economy depicted
Q95: <img src="https://d2lvgg3v3hfg70.cloudfront.net/TB3713/.jpg" alt=" -In the diagram
Q96: Consider an economy initially at long-run equilibrium
Q97: The aggregate demand curve shows the amount