Multiple Choice
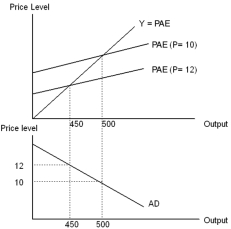
-The top and bottom panels of the diagram above show the relationship between the
A) short-run and the long-run equilibrium output.
B) planned aggregate expenditure curve and the aggregate demand curve.
C) real-balance effect and the Fisher effect.
D) nominal and the real expenditure curves.
E) real-balances effect and the foreign trade effect.
Correct Answer:

Verified
Correct Answer:
Verified
Q15: In the AD-AS model,stagflation does not persist,because
Q16: Which of the following will shift the
Q17: In the diagram below,the economy is initially
Q18: <img src="https://d2lvgg3v3hfg70.cloudfront.net/TB3713/.jpg" alt=" The SRAS is
Q19: According to the AD-AS model,the economy depicted
Q21: If the SRAS curve is positively sloped,then
Q22: Starting from the long-run equilibrium at point
Q23: According to the expectations-augmented Phillips curve model,the
Q24: One reason why the AD-AS model became
Q25: The idea that a change in the