Multiple Choice
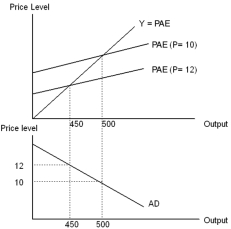
-In the top panel of the diagram above,the fall in the price level from P = 12 to P = 10 shifts the planned aggregate expenditure line and ___________ short-run equilibrium output from ___________ to ___________.
A) increases;450;500
B) decreases;500;450
C) decreases;500;12
D) increases;10;12
E) decreases;12;10
Correct Answer:

Verified
Correct Answer:
Verified
Q2: According to the expectations-augmented Phillips curve model,the
Q3: The expectations-augmented Phillips curve model assumes that
Q4: The short-run Phillips curve is<br>A) horizontal.<br>B) vertical.<br>C)
Q5: <img src="https://d2lvgg3v3hfg70.cloudfront.net/TB3713/.jpg" alt=" The SRAS is
Q6: The economy depicted in the diagram below
Q8: <img src="https://d2lvgg3v3hfg70.cloudfront.net/TB3713/.jpg" alt=" -The AD-AS model
Q9: If everything else is held constant,an increase
Q11: The aggregate demand curve shows the relationship
Q12: An important limitation of the AD-AS model
Q133: Consider an economy initially at long-run equilibrium