Multiple Choice
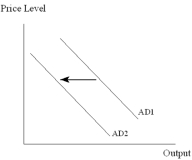
-The leftward shift in the aggregate demand (AD) curve,from AD1 to AD2,shown in the diagram above may be caused by a(n)
A) increase in autonomous consumption.
B) increase in government expenditure on roads and bridges.
C) decrease in autonomous private investment.
D) increase in autonomous net exports.
E) decrease in the interest ratE.
Correct Answer:

Verified
Correct Answer:
Verified
Q39: <img src="https://d2lvgg3v3hfg70.cloudfront.net/TB3713/.jpg" alt=" -The rightward shift
Q40: For the economy depicted in the diagram
Q41: <img src="https://d2lvgg3v3hfg70.cloudfront.net/TB3713/.jpg" alt=" The SRAS is
Q42: A model that can directly explain what
Q43: Which of the following will shift the
Q45: An economy is characterized by the AD
Q46: In recent decades,the statistical inverse relationship between
Q47: The idea that a change in the
Q48: <img src="https://d2lvgg3v3hfg70.cloudfront.net/TB3713/.jpg" alt=" The SRAS is
Q49: <img src="https://d2lvgg3v3hfg70.cloudfront.net/TB3713/.jpg" alt=" -The data provided