Flexible Pricing Chart -Consider the Flexible Pricing Chart Above,which Shows the Results of the Results
Multiple Choice
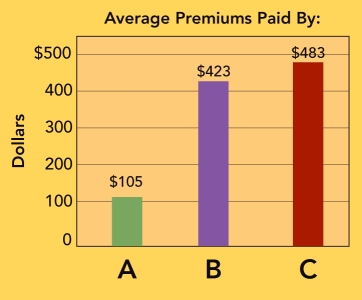 Flexible Pricing Chart
-Consider the flexible pricing chart above,which shows the results of a National Bureau of Economic Research study of 750,000 car purchases. The data indicate that some groups of car buyers,on average,paid roughly $105,$423,and $483 more,respectively,for a new car in the $21,000 range than the typical purchaser.Who are the car buyers in "A?"
A) women
B) the elderly
C) Hispanics
D) AfricanAmericans
E) Asian Anericans
Correct Answer:

Verified
Correct Answer:
Verified
Q13: key to setting a final price for
Q14: <img src="https://d2lvgg3v3hfg70.cloudfront.net/TB2495/.jpg" alt=" Red Bull price
Q16: a firm offers a very low price
Q17: <img src="https://d2lvgg3v3hfg70.cloudfront.net/TB2495/.jpg" alt=" Geographical Pricing Map
Q19: four types of discounts are<br>A) quantity, trade-in,
Q20: are the conditions favoring the use of
Q21: penetration pricing policy is MOST LIKELY to
Q22: method of pricing where the price the
Q23: <img src="https://d2lvgg3v3hfg70.cloudfront.net/TB2495/.jpg" alt=" Geographical Pricing Map
Q184: Odd-even pricing is based on<br>A)retailers' perceptions of