Multiple Choice
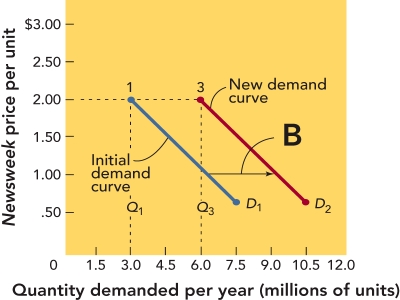 Figure 13-5B
-Figure 13-5B above,the demand curve shifts from D1 to D2.This most likely represents
A) an increase in demand that did not require a decrease in price.
B) an increase in demand that required an increase in price.
C) no change in price and no change in demand.
D) no change in demand or price but a greater profit due to economies of scale.
E) an increase in price from $0.50 to $1.50 per unit.
Correct Answer:

Verified
Correct Answer:
Verified
Q10: Basic to setting a product's price is
Q93: Marlow,the owner of The Clock Works,wanted to
Q94: owner of a small restaurant that sells
Q95: years,a local "greasy spoon" diner had customers
Q96: marketing director for a(n)_ is most likely
Q97: is the difference between a movement along
Q99: Price elasticity of demand is determined by
Q103: total expense incurred by a firm in
Q206: Occasionally, prices may rise later in the
Q216: Marginal revenue refers to<br>A)the additional money required