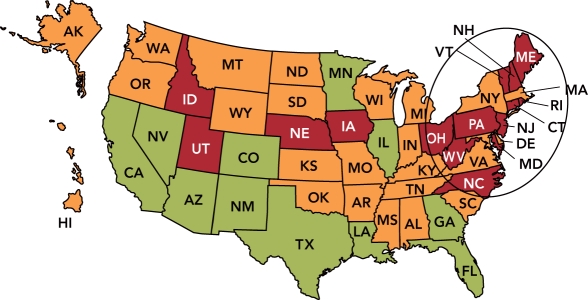
Marketing Dashboard Map -The Marketing Dashboard Map Shown Above,"green" Indicates an Annual Growth
Multiple Choice
 Marketing Dashboard Map
-the marketing dashboard map shown above,"green" indicates an annual growth rate that is greater than 10%; "orange" signifies an annual growth rate of between 0%-10%; and "red" represents a decline or negative annual growth rate.If an organization's 2011 sales for the entire U.S.were $50 million and its 2010 U.S.sales were $30 million,what is the annual % sales change?
A) 33%
B) 67%
C) 100%
D) 125%
E) 133%
Correct Answer:

Verified
Correct Answer:
Verified
Q91: Which of the following is considered a
Q295: product line is a group of product
Q296: you watch much television,you have seen the
Q298: retail chain hires a company to design
Q299: Apple innovation that stores all your digital
Q301: Electronics recently introduced the Fridge-TV.This is an
Q302: <img src="https://d2lvgg3v3hfg70.cloudfront.net/TB2495/.jpg" alt=" Thirsty Dog! Thirsty
Q303: screening and evaluation stage of the new-product
Q304: Which of the following is an example
Q305: Screening and evaluation refers to the stage