Multiple Choice
Which of the following diagrams represents the cardinality pairs in a situation where a specific production run results in a specific finished good,and a specific finished good is produced periodically?
A) 
B) 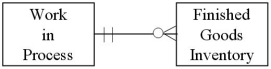
C) 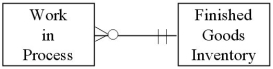
D) 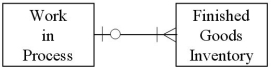
Correct Answer:

Verified
Correct Answer:
Verified
Q8: M:N agent-event relationships occur whenever an activity
Q10: The relationship between the Disburse Cash and
Q26: The temporal difference between Request Inventory and
Q26: Which of the following diagrams represents the
Q29: In an expanded revenue cycle REA diagram,picking
Q32: Which of the following accurately represents typical
Q34: Concerning cost data,which of the following is
Q36: Which of the following diagrams represents the
Q68: Why might an REA diagram show relationships
Q90: For a service business,the minimum cardinalities between