Multiple Choice
The figure below shows a graph of angular velocity as a function of time for a car driving around a circular track.Through how many radians does the car travel in the first 10 minutes? 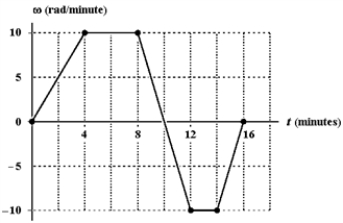
A) 30
B) 50
C) 70
D) 90
E) 100
Correct Answer:

Verified
Correct Answer:
Verified
Related Questions
Q3: Exhibit 10-1<br>The figure below shows a graph
Q7: Exhibit 10-2<br>The figure below shows a graph
Q24: A wheel rotates about a fixed axis
Q31: A small sphere attached to a light
Q40: Three particles, each of which has a
Q53: A cylinder rotating about its axis with
Q68: A wheel starts from rest and rotates
Q70: A wheel rotating about a fixed axis
Q76: Exhibit 10-3<br>The graph below shows a plot
Q80: A wheel rotates about a fixed axis