Multiple Choice
Exhibit 16-1
The figure below shows a sine wave at one point of a string as a function of time. 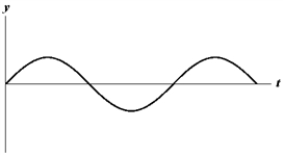 Use the exhibit to answer the following question(s) .
-Refer to Exhibit 16-1.Which of the graphs below shows a wave where the amplitude and the frequency are doubled?
A) 
B) 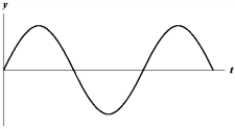
C) 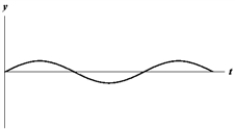
D) 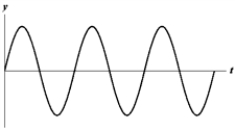
E) 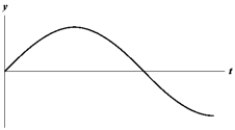
Correct Answer:

Verified
Correct Answer:
Verified
Related Questions
Q6: A circus performer stretches a tightrope between
Q11: The figure below represents a string which
Q19: For the wave described by y =
Q29: A piano wire of length 1.5 m
Q33: If y = 0.02 sin (30x −
Q48: Bats can detect small objects such as
Q68: If y = 0.02 sin (30x −
Q73: Exhibit 16-3<br>Four wave functions are given below.<br>I.y(x,
Q75: Write the equation of a wave, traveling
Q78: Bats can detect small objects such as