Essay
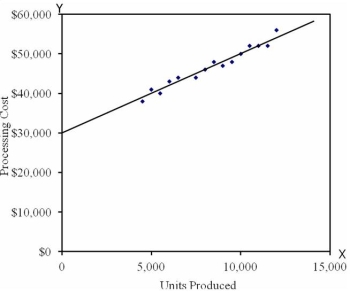
The graph below was produced after recording the processing costs of Oki Products observed over the last 10 months using the following data:
Required:
a.Using the graph identify the monthly fixed costs.What additional information might you determine from the graph?
b.The chart above indicates total processing costs of $47,000 at a level of 9,000 units for month 5.Using this level of activity and your fixed costs determined in a,calculate the variable cost per unit to the nearest cent.Express your results in the form of a linear equation y = a + bx.
c.Use the high low method to determine the variable cost per unit and fixed cost per month.Express your results in the form of a linear equation y = a + bx.
d.Comment on the differences between the results in b and c.Which result would you consider more accurate and why?
Correct Answer:

Verified
a.From the graph it is clear from where ...View Answer
Unlock this answer now
Get Access to more Verified Answers free of charge
Correct Answer:
Verified
View Answer
Unlock this answer now
Get Access to more Verified Answers free of charge
Q74: At an activity level of 10,000 units,total
Q75: Contribution margin is the excess of revenues
Q76: The following data pertain to activity
Q77: Given the cost formula Y = $15,000
Q80: In the O'Donnell Manufacturing Company, at
Q81: The following information summarizes the company's
Q82: Selected data about Pitkin Company's manufacturing
Q83: The "goodness of fit" statistic (that is,R-squared)associated
Q84: Which of the following is generally true
Q147: In order for a cost to be