Multiple Choice
The graph shown is of position versus time.Which statement best describes it? 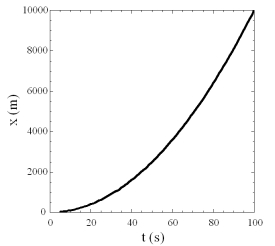
A) v reaches a maximum of about 200 m/s.
B) a is always negative.
C) a is both positive and negative.
D) v decreases with time.
E) The velocity is never zero.
Correct Answer:

Verified
Correct Answer:
Verified
Related Questions
Q11: At time,t = 0 s,car A is
Q12: The graph shown is of velocity versus
Q13: A plane lands at 50.0 m/s,and its
Q14: The position of a nanoparticle as a
Q15: In this graph of distance vs.time,which of
Q17: The figure shows the position of a
Q18: A heavy ball is dropped into a
Q19: A car can accelerate from zero to
Q20: What is your average speed in m/s
Q21: The figure shows the position of a