Multiple Choice
The figures below show plots of monthly excess returns for two stocks plotted against excess returns for a market index. 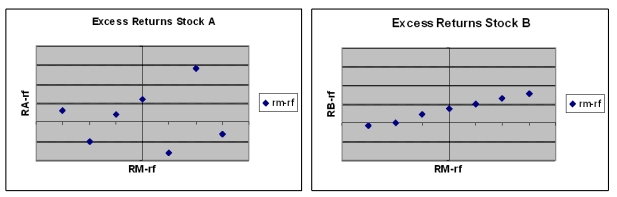
-Which stock is riskier to a non-diversified investor who puts all his money in only one of these stocks?
A) Stock A is riskier
B) Stock B is riskier
C) Both stocks are equally risky
D) You cannot tell from the information given.
Correct Answer:

Verified
Correct Answer:
Verified
Q15: Consider two perfectly negatively correlated risky securities,
Q52: An investor can design a risky portfolio
Q54: Which of the following is a
Q55: Which of the following correlation coefficients will
Q56: Market risk is also called _ and
Q59: Suppose that a stock portfolio and a
Q60: Which of the following statistics cannot be
Q79: Diversification can reduce or eliminate _ risk.<br>A)
Q83: Adding additional risky assets to the investment
Q85: Consider an investment opportunity set formed with