Essay
Paula Corporation is trying to predict its manufacturing overhead costs for the upcoming year; they are debating the use of the high-low method versus the use of regression analysis. They have gathered information about their manufacturing overhead costs in each of the past six months. A table containing their cost data and the associated machine hours in each month (the cost driver)follows.
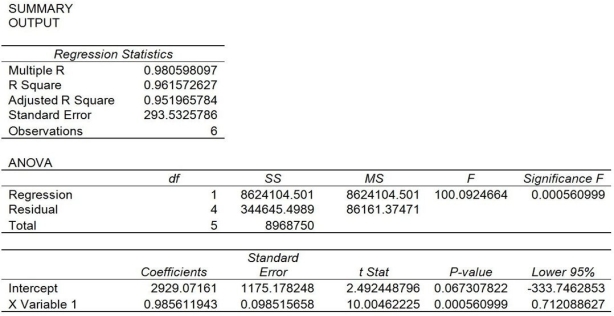
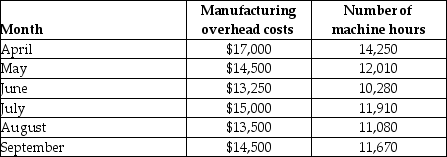 The company performed a regression analysis using the above data and had the following results. (Note: the results are excerpts so not all of the regression analysis results are presented.)
 Required:
a. What is the cost equation if the high-low method is used to estimate costs?
b. Using the high-low method, predict total manufacturing overhead costs if Paula Corporation uses 12,000 hours.
c. What is the cost equation if regression analysis is used to estimate costs (use the results from the regression analysis provided)?
d. Using the results from the regression analysis provided, predict total manufacturing overhead costs if Paula Corporation uses 12,000 hours.
e. Which method (high-low or regression analysis)is a better predictor of total manufacturing overhead costs? Why?
Correct Answer:

Verified
a.
 y = $0.94x + $3,540
b.
c. y = $0....View Answer
Unlock this answer now
Get Access to more Verified Answers free of charge
Correct Answer:
Verified
b.
View Answer
Unlock this answer now
Get Access to more Verified Answers free of charge
Q27: The line on a graph representing total
Q28: <img src="https://d2lvgg3v3hfg70.cloudfront.net/TB3059/.jpg" alt=" Cost A is
Q29: With respect to total variable costs, which
Q30: Regression analysis uses all data points, not
Q31: Which type of cost behavior is indicated
Q33: If inventory has grown, operating income will
Q34: Hyper Color Company manufactures widgets. The following
Q35: An expense such as advertising could be
Q36: Total mixed cost graphs slope upward but
Q37: Hyper Color Company manufactures widgets. The following