menu-iconExamlexExamLexServices

Discover

Ask a Question
  1. All Topics
  2. Topic
    Business
  3. Study Set
    Microeconomics Study Set 15
  4. Exam
    Exam 3: Where Prices Come Frome : The Interaction of Demand and Supply
  5. Question
    Use the Following Supply Schedule for Cherries to Draw a Graph
Solved

Use the Following Supply Schedule for Cherries to Draw a Graph

Question 189

Question 189

Essay

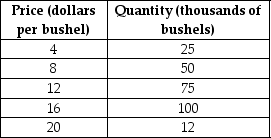
Use the following supply schedule for cherries to draw a graph of the supply curve. Be sure to label the supply curve and each axis, and show each point on the supply curve.

Correct Answer:

verifed

Verified

Unlock this answer now
Get Access to more Verified Answers free of charge

Related Questions

Q37: A decrease in quantity supplied is represented

Q44: In June, buyers of titanium expect that

Q94: Explain the differences between a change in

Q100: Technological advances have resulted in lower prices

Q134: The Internet has created a new category

Q146: What is the ceteris paribus condition?

Q232: Figure 3-7<br> <img src="https://d2lvgg3v3hfg70.cloudfront.net/TB4193/.jpg" alt="Figure 3-7

Q237: What is the law of supply? What

Q249: Let D = demand, S = supply,

Q370: Figure 3-2 <img src="https://d2lvgg3v3hfg70.cloudfront.net/TB7397/.jpg" alt="Figure 3-2

Examlex

ExamLex

About UsContact UsPerks CenterHomeschoolingTest Prep

Work With Us

Campus RepresentativeInfluencers

Links

FaqPricingChrome Extension

Download The App

Get App StoreGet Google Play

Policies

Privacy PolicyTerms of ServiceHonor CodeCommunity Guidelines

Scan To Download

qr-code

Copyright © (2025) ExamLex LLC.

Privacy PolicyTerms Of ServiceHonor CodeCommunity Guidelines