Multiple Choice
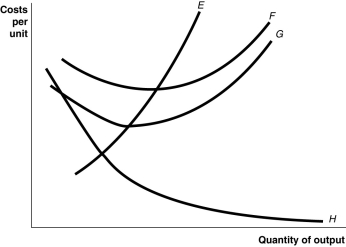
-Refer to Figure 7-5. Identify the curves in the diagram.
A) E = average fixed cost curve; F = variable cost curve; G = total cost curve, H = marginal cost curve
B) E = marginal cost curve; F = total cost curve; G = variable cost curve, H = average fixed cost curve
C) E = average fixed cost curve; F = average total cost curve; G = average variable cost curve, 
D) E = marginal cost curve; F = average total cost curve; G = average variable cost curve; 
Correct Answer:

Verified
Correct Answer:
Verified
Q49: Figure 7.11 <img src="https://d2lvgg3v3hfg70.cloudfront.net/TB1015/.jpg" alt="Figure 7.11
Q52: Use the following graph to answer the
Q96: In the short run, if average product
Q152: Adam spent $10,000 on new equipment for
Q168: What is an isoquant? What is the
Q181: Which of the following statements explains the
Q182: The total output produced by a firm
Q228: Describe the relationship between marginal cost and
Q233: As the level of output increases, what
Q234: In the short run, why does a