Essay
Figure 10.10 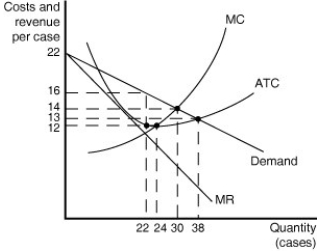 Figure 10.10 shows cost and demand curves for a monopolistically competitive producer of iced tea.
-Refer to Figure 10.10.to answer the following questions.
a.What is the profit-maximising output level?
b.What is the profit-maximising price?
c.At the profit-maximising output level, how much profit will be realised?
d.Does this graph most likely represent the long run or the short run? Why?
__________________________________________________________________________________________________________________________________________________________________________________________
Correct Answer:

Verified
a.The profit-maximising output...View Answer
Unlock this answer now
Get Access to more Verified Answers free of charge
Correct Answer:
Verified
View Answer
Unlock this answer now
Get Access to more Verified Answers free of charge
Q33: Monopolistically competitive firms face a perfectly elastic
Q42: In the long run, if price is
Q64: Although advertising raises the price of a
Q95: A franchise is<br>A)a firm that buys and
Q180: Figure 10.14 <img src="https://d2lvgg3v3hfg70.cloudfront.net/TB1015/.jpg" alt="Figure 10.14
Q181: How do consumers benefit from monopolistic competition?<br>A)By
Q186: Suppose a monopolistically competitive firm's output where
Q187: Figure 10.8 <img src="https://d2lvgg3v3hfg70.cloudfront.net/TB1015/.jpg" alt="Figure 10.8
Q189: Table 10.2 <img src="https://d2lvgg3v3hfg70.cloudfront.net/TB1015/.jpg" alt="Table 10.2
Q190: Table 10.4 <img src="https://d2lvgg3v3hfg70.cloudfront.net/TB1015/.jpg" alt="Table 10.4