Multiple Choice
The table below indicates the price and output data over a five year period for an economy that produces only one good.
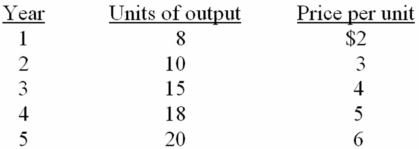
-Refer to the above data.If year 2 is the base year,the price index for year 3 is:
A) 120
B) 125
C) 133
D) 150
Correct Answer:

Verified
Correct Answer:
Verified
Q42: The table below indicates the price and
Q46: <img src="https://d2lvgg3v3hfg70.cloudfront.net/TB2474/.jpg" alt=" -Refer to the
Q48: Assume an economy which is producing only
Q49: Consider the following data for a hypothetical
Q69: In the treatment of Canadian exports and
Q130: The GDP price index:<br>A)includes fewer goods and
Q140: Which of the following is the smallest
Q145: National income accountants can avoid multiple counting
Q185: If real GDP in a particular year
Q199: In an economy, the value of inventories