Multiple Choice
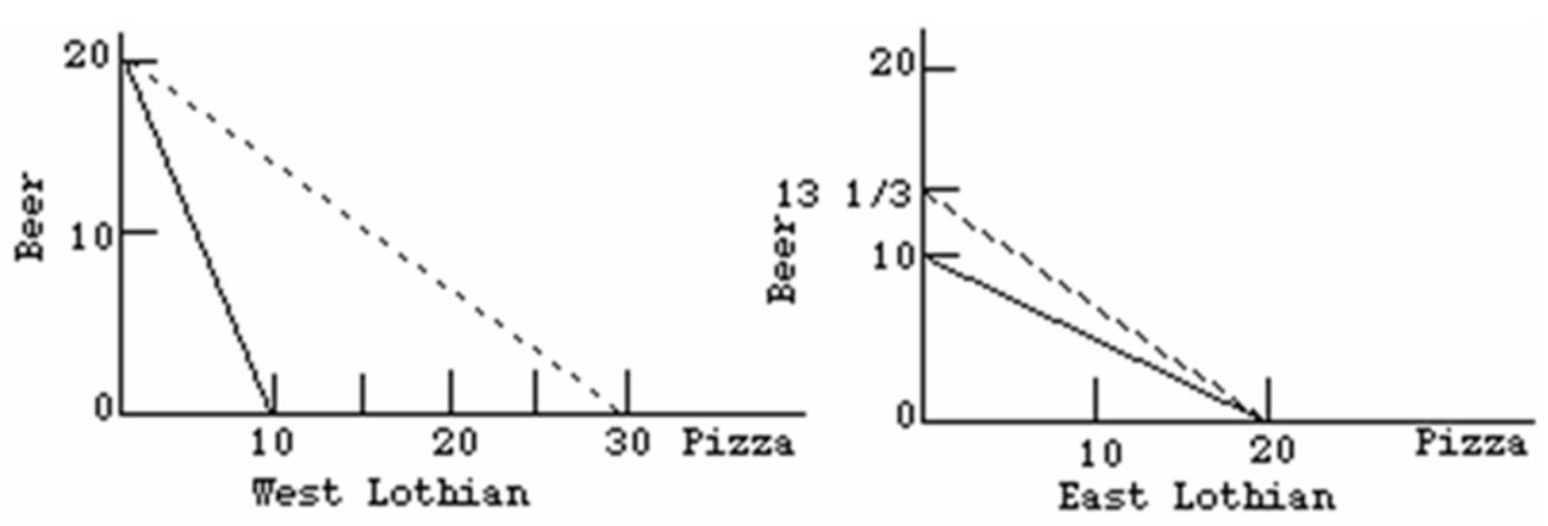
-Refer to the above diagrams.The solid lines are production possibilities curves;the dashed lines are trading possibilities curves.The opportunity cost of producing a:
A) pizza is 2 beers in both countries.
B) beer is 1/2 a pizza in both countries.
C) pizza in East Lothian is 1 beer.
D) beer in West Lothian is 1/2 a pizza.
Correct Answer:

Verified
Correct Answer:
Verified
Q32: Which of the following is the best
Q43: In comparing a tariff and an import
Q92: When a tariff on a product is
Q114: The major difference between a tariff and
Q141: The following table is domestic supply and
Q142: <img src="https://d2lvgg3v3hfg70.cloudfront.net/TB2474/.jpg" alt=" -Refer to the
Q145: The production possibilities curves below suggest that:
Q148: The data embodied in the below diagrams
Q151: The following data is for the hypothetical
Q242: Tariffs and import quotas meant to increase